We’ve written about cycles before. Kondratiev waves, the hegemonic cycle, the Benner window, the liquidity sine wave. All useful as a map – you can see where you’ve been, you can see where the system is heading over the long term. But one question remains: how do you know where you are right now? The map shows direction. The compass shows position.
Today – two compasses, built by different people, in different decades, from different angles, but pointing at the same thing: where we are in the cycle and what’s happening beneath the surface.
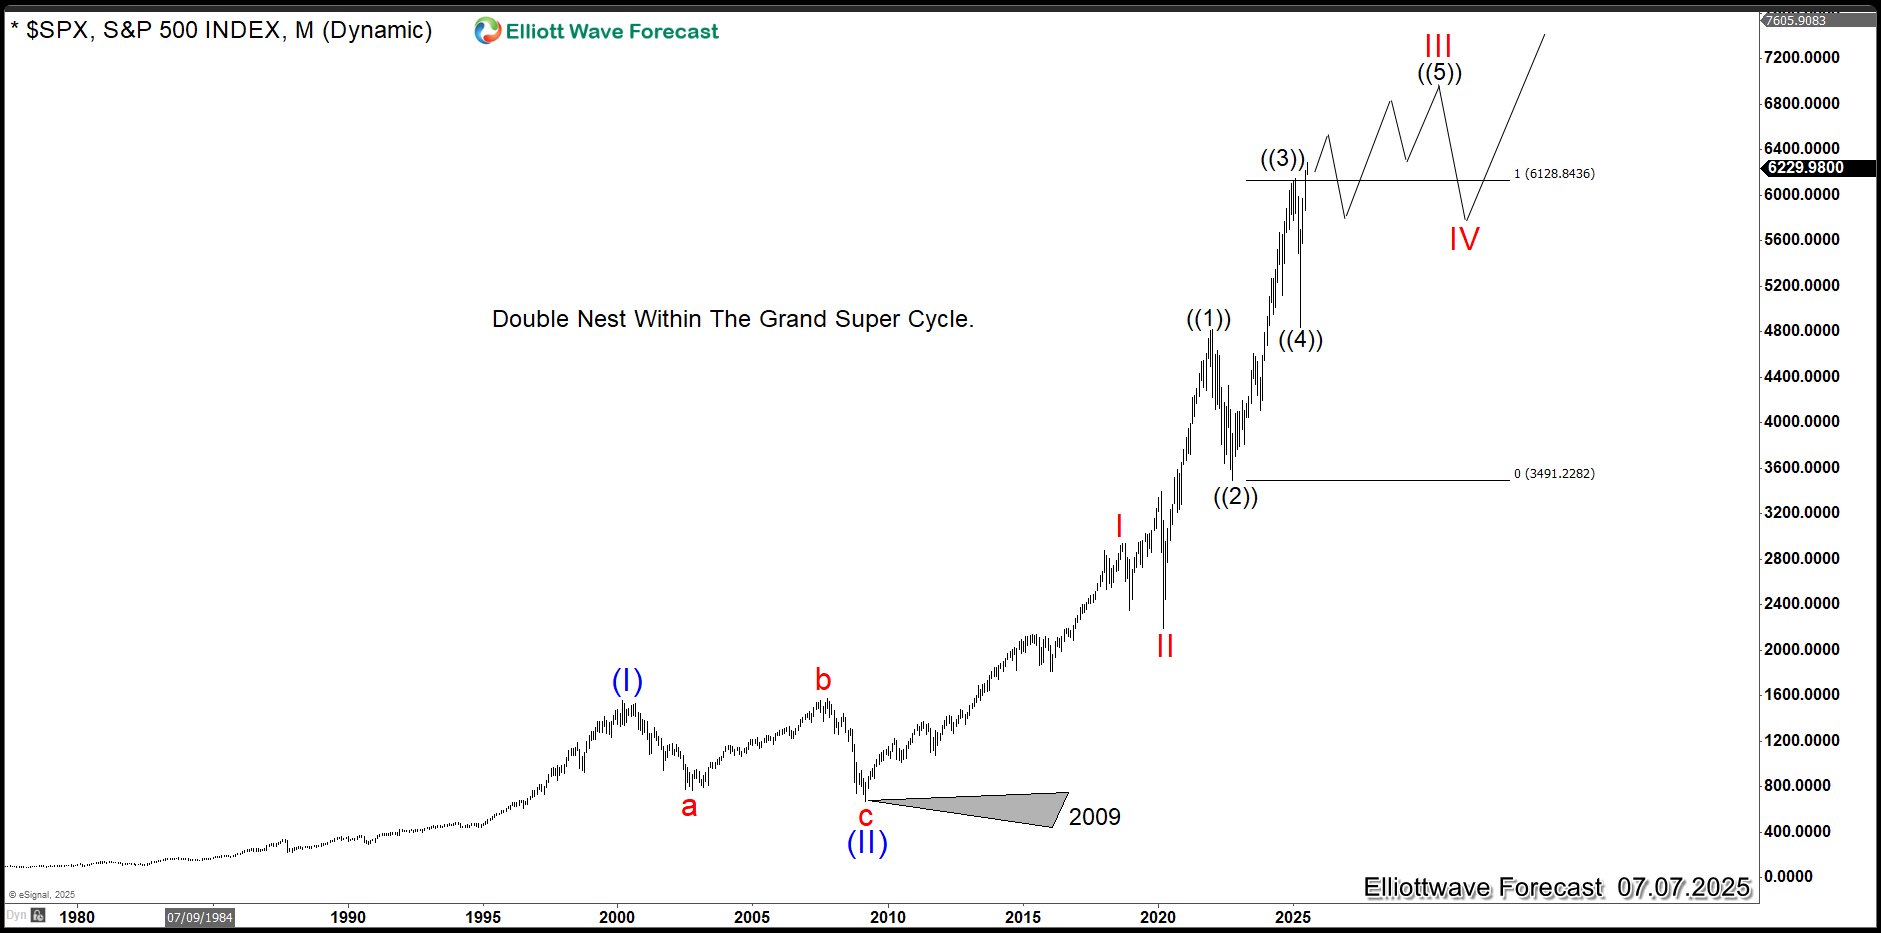
First compass: Elliott Waves
The Elliott Wave principle says something simple: markets move in structure. Five moves in the direction of the trend (impulse), three against (correction). And each of those moves is itself made up of smaller waves – the same 5+3 structure, just at a smaller scale. A fractal, though Elliott didn’t know the word – Mandelbrot wouldn’t formulate fractal geometry until 1975.
Why does it work? Because markets are a mirror of collective psychology. The first wave – early optimism, when a minority spots the opportunity. The third – mass participation, when everyone believes the rally will never end. The fifth – the final push, when the market rises on inertia and FOMO, while smart money quietly exits.
Now look at the S&P 500. Elliott Wave analysts – Avi Gilburt, FXEmpire, the Investing.com team – currently see the same picture: the index is in the fifth wave. More precisely, in wave ((iii)) within a larger wave (5), with recent highs at 6,988. Target zone: 7,345–7,490 by the end of April. After that – a correction that analysts compare to the 2022 bear market.
The fifth wave has a characteristic: it often ends with a blow-off top – a final euphoric surge where prices rise faster than fundamentals, and retail investors pile in to buy exactly what institutions are already selling.
Wave structure tells you where you are. But what creates that structure – for that, you need Wyckoff.
Second compass: The Wyckoff Method
Richard Wyckoff was no academic. He was a Wall Street insider – broker, magazine editor, floor trader – who saw from the inside how the big players manipulate the market. And he understood one essential thing: the market has two modes. Accumulation – when smart money quietly buys while everyone is afraid. Distribution – when smart money quietly sells while everyone is buying.
Wyckoff created the Composite Man concept – an imaginary operator who controls the market. The Composite Man accumulates positions at the bottom, creates demand, lets the price rise, and when retail investors rush in – distribution. He sells them what he bought cheap.
The distribution phase looks like this: the market moves sideways after a long rally, with false breakouts to the upside (Wyckoff calls this UTAD – Upthrust After Distribution) that create the illusion the rally continues. Retail buyers see a “new high” and buy. Smart money sells into them. When distribution is complete – prices fall.
SpaceX IPO: both compasses point the same way
On April 1, 2026, SpaceX confidentially filed its IPO registration documents with the SEC. Valuation: $1.75 trillion. Planned raise: $75 billion – the largest IPO in history, three times larger than Alibaba in 2014. And the key detail: Elon Musk is considering allocating 30% of IPO shares to retail investors. The standard retail allocation is 5–10%.
Through the Elliott lens: the largest IPO in history arrives at precisely the moment when the S&P 500 is approaching its fifth wave peak. A blow-off top needs fuel – and what better fuel than a record IPO that attracts millions of retail buyers?
Through the Wyckoff lens: a 30% retail allocation isn’t generosity. A standard IPO gives retail 5–10% because institutions want as many shares for themselves as possible. When institutions want to give retail three times the usual amount – that’s not charity. Wyckoff would call it distribution: the Composite Man selling his positions to retail buyers at peak prices. SpaceX’s early investors – Founders Fund, Sequoia, Google – have been buying since 2008. Their positions have grown hundreds of times over. The IPO is their exit, not retail’s entry.
Both compasses point the same way: the fifth wave peak, the distribution phase, and a record-setting instrument through which smart money hands off positions to retail.
Two people, two perspectives
Ralph Nelson Elliott – an accountant who spent his life working for railroad companies in Latin America. Fell ill in 1929, returned to New York as an invalid, and in bed, with chart pages and a pencil, analyzed 75 years of market data. He saw a wave structure that the professionals had missed. He was 67 when he published “The Wave Principle.” Died in 1948, unknown to most. Elliott Waves only gained real popularity in the 1980s through Robert Prechter.
Richard Wyckoff – the opposite. A Wall Street veteran who started working at fifteen, became one of the most recognized market analysts of his era. Edited “The Magazine of Wall Street,” ran his own brokerage firm. He didn’t search for structure from the outside – he saw the mechanism from within. And he understood that most retail traders lose not because they lack knowledge, but because they’re playing against players who control the rules.
Elliott saw form – the wave sequence that repeats at every scale. Wyckoff saw the force that creates that form – institutional money that accumulates at the bottom and distributes at the top. One gave us structure, the other – mechanics. Together, they explain not just what is happening, but why.
The Benner analogy
Samuel Benner – yet another man who tried to understand the structure of cycles. An Ohio farmer, ruined by the Panic of 1873, who spent a decade analyzing commodity prices and in 1884 published “Benner’s Prophecies of Future Ups and Downs in Prices.” His cycle – 16, 18, 20-year peaks, corrections, and bottoms – matched market history from the 19th century through the present with surprising accuracy. We wrote about this in our article on cycle convergence in 2026.
Benner, Elliott, and Wyckoff are saying the same thing in different languages. Benner gives the time window – when to expect the peak. Elliott shows which wave phase we’re in within that window. Wyckoff explains what specifically happens between the big and small players when that phase materializes. Each sees a part; together – the whole mechanism.
What to watch
Elliott Wave analysts see the S&P 500 fifth wave target zone at 7,345–7,490, with a time window through the end of April. If the index reaches this zone and begins to correct – that would be a classic fifth wave completion.
Through the Wyckoff lens: watch volume. In the distribution phase, the heaviest volume comes at rally peaks, while corrections see declining volume. If you see the S&P 500 climbing to new highs on declining volume – that’s a classic distribution signal.
SpaceX IPO: if it happens in June (as planned) and attracts record retail participation – the IPO itself could become the peak marker that future textbooks will cite. The largest IPO in history, the most retail buyers, right at the fifth wave peak. This doesn’t necessarily mean SpaceX is a bad company – it could be a great company, bought at the wrong time, at too high a price, in the wrong phase of the cycle.
I might be wrong. The fifth wave could extend, the market could hold higher for longer than anyone expects, and SpaceX IPO could turn out to be a successful investment. Cycles show probabilities, not guarantees. But when two independent compasses – wave structure and smart money mechanics – point in the same direction, it’s worth at least pausing to think before rushing to buy.
P.S. Wyckoff wrote in his book: “The majority of public investors lose because they play against those who control the game.” A hundred years have passed. The mechanism hasn’t changed.
If this text helped you see context that’s missing from everyday news – share it with someone who cares about it too. The best conversations start with a good question.
Sources / Further reading ▸
Primary sources
- Ralph Nelson Elliott, “The Wave Principle” (1938) and “Nature’s Law — The Secret of the Universe” (1946)
- Richard D. Wyckoff, “The Richard D. Wyckoff Method of Trading and Investing in Stocks” (1931)
Modern interpretations
- Robert Prechter & A. J. Frost, “Elliott Wave Principle” (1978, updated editions)
- Hank Pruden, “The Three Skills of Top Trading” (2007) — modern synthesis of the Wyckoff method
- Jack Schwager, “Market Wizards” series — practical case studies
Context
- Henrik Zeberg, business cycle model — how Elliott wave structure aligns with liquidity cycles
- Charles Kirkpatrick & Julie Dahlquist, “Technical Analysis” (CMT Association textbook)